Update 12 Jan 2022 – Most of this is wildly out of date. It was useful back-in-the-day as reference points of definitions, links, and research papers, but I can’t really vouch for it now as being up to date.
Links with live updates, graphs, data. Pinned at the top of the category page.
Table of Contents
Live updates
| Site | Links | Details |
|---|---|---|
| 1Point3Acres | COVID-19/Coronavirus Live Updates With Credible Sources in US and Canada | Sources: The COVID Tracking Project (see The COVID Tracking Project > Data Visualizations) |
| CDC | Cases in U.S. | lagging updates |
| Chartable | 17 (or so) responsible live visualizations about the coronavirus, for you to use | Sources: Johns Hopkins (credited in graphs) |
| The COVID Tracking Project | spreadsheet and API Sources: DHS by state (see The COVID Tracking Project > About the Data) | |
| Covid Trends | animated graph mapping new cases against total cases, found at A better COVID-19 graph from Language Log | |
| European Centre for Disease Prevention and Control (ECDC) | COVID-19 | |
| Financial Times | Coronavirus tracked: the latest figures as the pandemic spreads | static graphs/maps, frequently updated Sources: Johns Hopkins, Worldometer (credited in graphs) |
| Johns Hopkins | Coronavirus Resource Center | best Published at: github / CSSEGISandData / COVID-19 Sources: 1point3acres, BNO, CDC, DXY, ECDC, NHC, WHO, Worldometers.info, state and national government health departments, and local media reports” (see the main page) |
| Live Science | Coronavirus in the US: Map, case counts and news | Sources: Johns Hopkins (credited in graphs) |
| The New York Times | Coronavirus in the U.S.: Latest Map and Case Count The Coronavirus Outbreak | Published at: github / nytimes / covid-19-data |
22 Oct 2020 – not sure when, but the graphs have been removed | Totals | bottom of page has city/county/state search with graph and map Sources: CDC, WHO, ECDC, Wikipedia (see icon in the lower left) |
5 Apr 2020 – unfortunately this has been down for the last day | Coronavirus Pandemic: Real Time Counter, World Map, News (live video) | best Sources: see below |
| Unacast | The Unacast Social Distancing Scoreboard | |
| Wikipedia | 2019–20 coronavirus pandemic by country and territory | |
| Worldometer | United States Coronavirus | best Sources: government and world sites (see Worldometer > Sources) |
| World Health Organization (WHO) | Coronavirus disease (COVID-19) Pandemic (WHO) |
(deprecated since 5 Apr 2020) Live video stream
Roylab Stats live stream:
Data sources:
| Site | Country |
|---|---|
| 1Point3Acres | USA/CAN |
| Amtliches Dashboard COVID19 | AUT |
| BNO News | NL |
| DXY | CHN |
| J.A.G Japan | JPN |
| Johns Hopkins | |
| MorgenPost | DEU |
| RiskLayer | DEU |
| VG | NOR |
| Worldometer |
Raw data and APIs
| Site | Links |
|---|---|
| The COVID Tracking Project | spreadsheet, API (JSON and CSV) |
| Johns Hopkins | github / CSSEGISandData / COVID-19 |
| The New York Times | github / nytimes / covid-19-data |
Graphs
| Cases extrapolated from previous data |
| Cases extrapolated from previous data (2nd version, Sat 21 Mar 2020, less wildly off) |
| Successive Financial Times graphs of the spread by country |
Timelines
Rolling updates on coronavirus disease (COVID-19) from WHO. Also links to their interactive timeline.
Red Dawn emails – An email discussion list between epidemiologists and other health experts, started in early Jan 2020 to share information on the virus.
- He Could Have Seen What Was Coming: Behind Trump’s Failure on the Virus (New York Times, 11 Apr 2020) – Original report on the email thread
- PDF – Archive of the original emails (with redactions)
- As coronavirus threatened invasion, a new ‘Red Dawn’ team tried to save America (ABC News, 28 Jul 2020) – Interviews with six of the participants in the email chain.
Asymptomatic, pre-symptomatic, subclinical – Timeline of our understanding of asymptomatic transmission.
Coronavirus – 24 Jul 2020 – Rewriting history – How the federal and some state governments from 15 Jul 2020 to 23 Jul 2020 tried to suppress data about the virus’s virulence and spread.
Info
General facts and sources
| HCQ – concerning the French and Shanghai studies of it effectiveness against COVID-19 |
| Masks and their usefulness |
| Politifact – Coronavirus |
| SARS and MERS – incubation periods, treatments, comparisons with COVID-19 |
| Is COVID-19 the flu? * The flu killed 80,000 people in the U.S. last year (PolitiFact) – Mostly False. That number is not from any official report and the actual numbers are only estimates. * Comparing COVID-19 Deaths to Flu Deaths Is like Comparing Apples to Oranges (Scientific American) – “In the last six flu seasons, the CDC’s reported number of actual confirmed flu deaths has ranged from 3,448 to 15,620” |
| Terminology – vaccines, diseases, viruses |
| Blood oxygen level – Coronavirus FAQS: What’s A Pulse Oximeter? Is It A Good Idea To Buy One? – “You want a number in the 95% to 100% range. If the number drops to 92% or lower, that’s a cause for concern. That’s generally the level where a doctor might put you on supplementary oxygen and keep you in the hospital for observation.” |
Persistence on surfaces
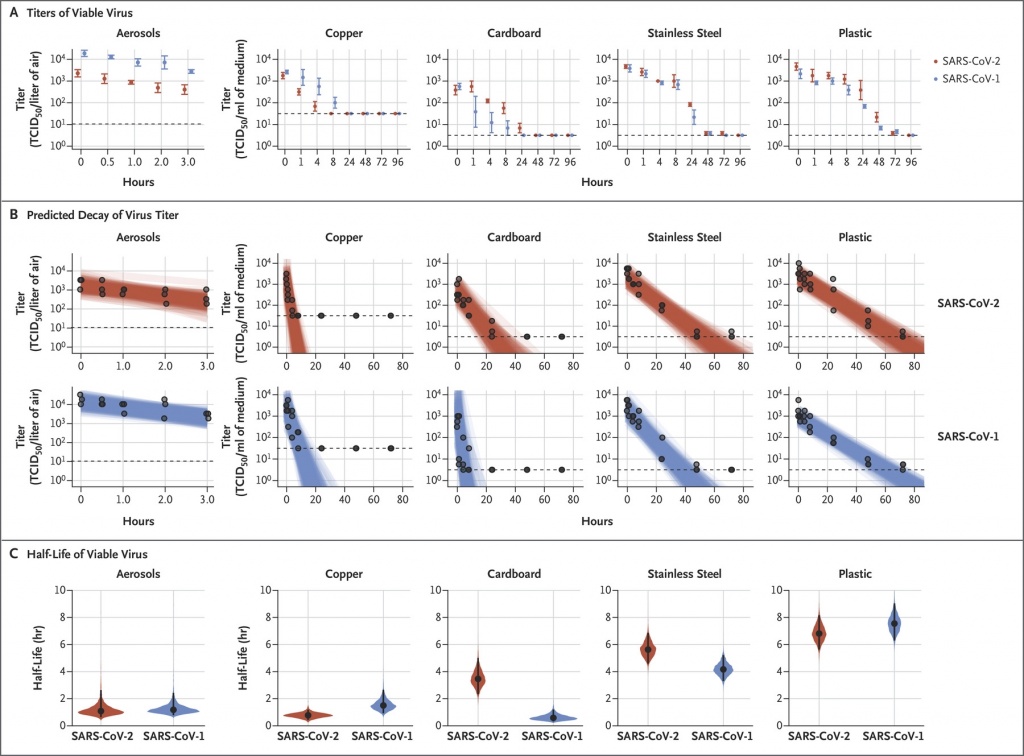
Here’s how long the coronavirus will last on surfaces, and how to disinfect those surfaces. (Live Science) from 18 Mar 2020. The short answer (using the times from the currently active SARS-CoV-2):
• Air for up to 3 hours, half-life 1.1-1.2 hours.
• Copper for up to 4 hours
• Cardboard up to 1 day, half-life 3.2 hours.
• Plastic and stainless steel up to 3 days. Plastic half-life 6.8 hour, and stainless steel half-life 5.6 hours.
Long answer in chart below:
Dispersal and particles released
How much of the virus is dispersed from a person? – It may (only an estimate) take 1,000 particles to become infected. Amount that is dispersed in the table below:
| Type of Dispersal | Droplets Dispersed | Speed of Dispersal | Viral Particles Released | Distance |
|---|---|---|---|---|
| breathing | 50-5,000 | 20/min | several meters | |
| speaking | 500-50,000 | 200/min | several meters | |
| coughing | 3000 | 50 mph | 200 million | 10+ meters (small droplets) |
| sneezing | 30000 | 200 mph | 200 million | 10+ meters (small droplets) |
additions from It is Time to Address Airborne Transmission of COVID-19 (Oxford Academic, 6 Jul 2020), summarized Coronavirus can float in air and WHO and CDC should tell people that, experts say (CNN, 6 Jul 2020)
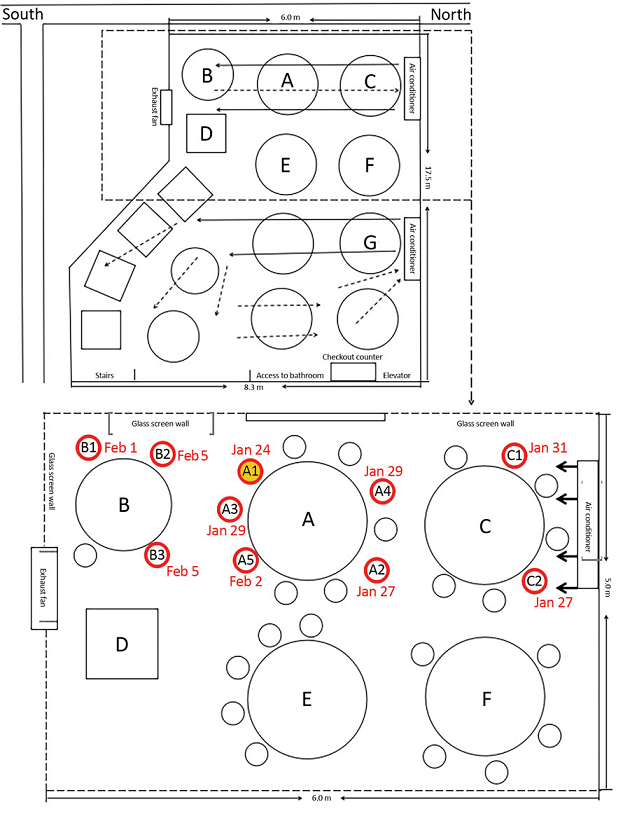
An important study regarding an early instance of airborne spread examines how 2 families in a restaurant in China became infected by a different family who sat in front of the A/C vent that blew air to the two.
Abstract
COVID-19 Outbreak Associated with Air Conditioning in Restaurant, Guangzhou, China, 2020 (Covid-19 Hub, 10 Feb 2020)
During January 26–February 10, 2020, an outbreak of 2019 novel coronavirus disease in an air-conditioned restaurant in Guangzhou, China, involved 3 family clusters. The airflow direction was consistent with droplet transmission. To prevent the spread of the virus in restaurants, we recommend increasing the distance between tables and improving ventilation.