Updated with chart the next day
Updated Wed 25 Mar 2020: These number became too aggressive after two day. Bad math or good luck?
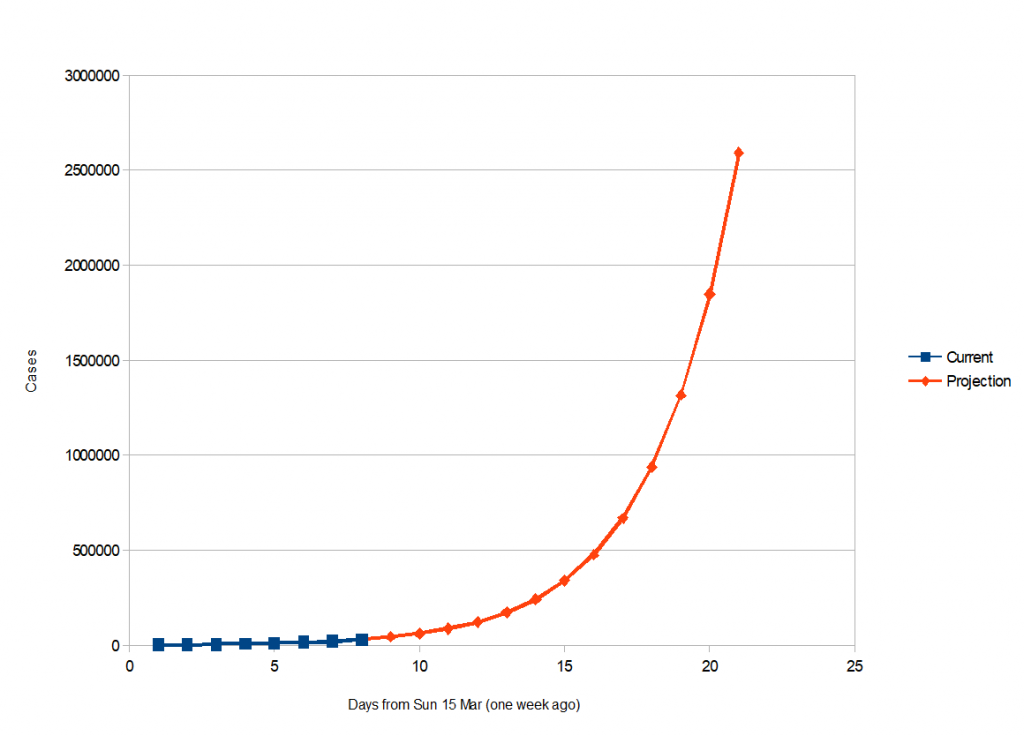
| Date | Current | Projection |
| 20200315 | 3173 | 2981 |
| 20200316 | 4019 | 4181 |
| 20200317 | 5723 | 5865 |
| 20200318 | 7731 | 8227 |
| 20200319 | 11723 | 11539 |
| 20200320 | 17038 | 16186 |
| 20200321 | 23203 | 22703 |
| 20200322 | 31057 | 31845 |
| 20200323 | 44668 | |
| 20200324 | 62654 | |
| 20200325 | 87883 | |
| 20200326 | 123270 | |
| 20200327 | 172906 | |
| 20200328 | 242530 | |
| 20200329 | 340188 | |
| 20200330 | 477170 | |
| 20200331 | 669310 | |
| 20200401 | 938818 | |
| 20200402 | 1316848 | |
| 20200403 | 1847097 | |
| 20200404 | 2590859 |
Original post
People are getting scared and angry about Trumps lies about the virus and the country’s status in combating it. From Maddow (via @jayrosen_nyu), re Trump:
- Jumped the gun on availability and effectiveness of HCQ.
- Promised 1.4 million test by mid-April, currently at 138,000.
- Promised a Google website, that is at best in beta and not intended for national use, and threw shade at the speed with which the ACA website was ramped up.
- Promised two medical ships that a week later are under maintenance and don’t have any medical personnel on board.
- Promised ventilators and face masks, that won’t be ready for at least a year, then told governors to fend for themselves.
People increasingly want to stop the president from having briefings because his lies put people in danger.
Today we are switching our coverage of Donald Trump to an emergency setting from PressThink, the blog of NYU professor Jay Rosen. His thinking on the issue is laid out here. If reporters confront him on his lies he’ll spout four more, further hurting people. Best to put the equivalent of a 5-second delay on him: no live broadcasts of him, and report what he says only after full vetting. Also, report nothing none of his incendiary bullshit (China virus, “nasty question”, etc.).
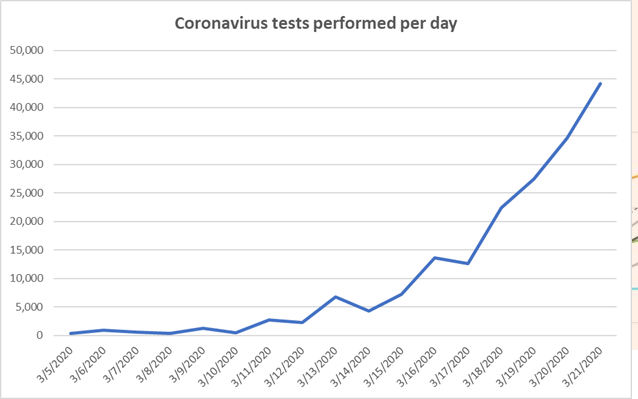
The U.S. is up to around 44,000 tests per day. This is about 36% of South Korean per capita levels. The amount is increasing at about 25% per day. At this rate, we’ll be at Korean levels in ~4 days. But if increase goes linear, it’ll take ~11 days.
There’s a Google Docs spreadsheet (shared by @Noahpinion above) with, what I assume is daily, Coronavirus numbers by state and for the whole country. The README tab links to several reference sites including the @COVID19Tracking Twitter account and The COVID Tracking Project website, which contains further details for the spreadsheet data. It starts from 4 Mar 2020 (118 cases) to today 21 Mar 2020 (23,203 cases).
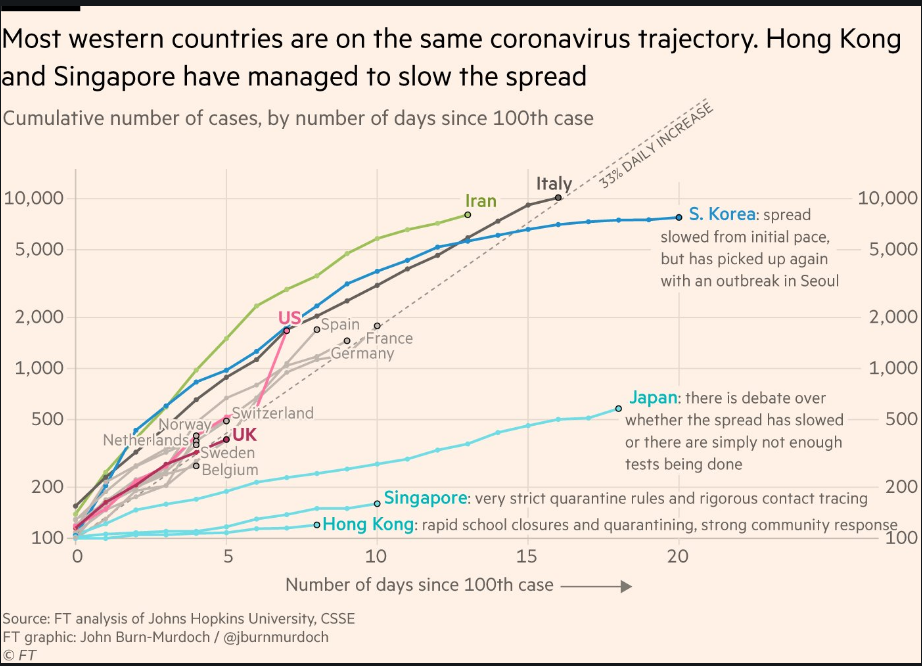
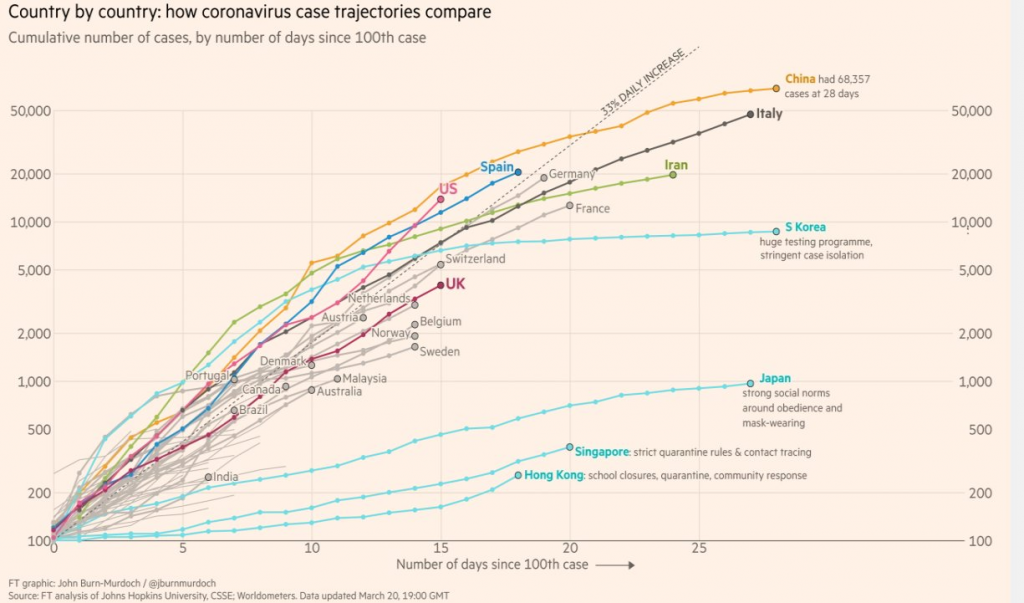
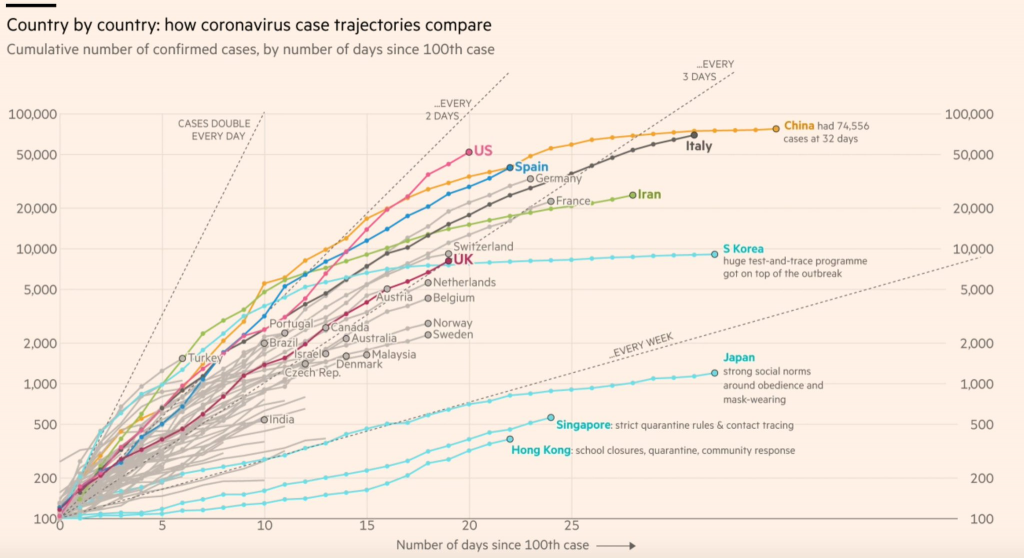
Successive Financial Times graphs of the spread by country
The first graph below is from my initial post (one week ago on 12 Mar 2020). How quaint that it tops off at 10,000 cases. The next is from one day ago and has us spiking faster than Italy. Both graphs from Financial Times.
Every few hours I get in a slow panic but try to give myself enough distractions. There’re the smaller potential outcomes–am I or Lisa asymptomatic?–and the larger realities–years for the world to fully recover after losing what may be million after healthcare system capacity is reached.

Updated days later
Need to remember, grimly, that hospital TV shows were donating supplies to real hospitals. How ‘Grey’s Anatomy’ And Other Shows Are Helping Real Hospitals Fight Coronavirus (19 Mar 2020) lists The Resident, Grey’s Anatomy, Station 19, and The Good Doctor. A Trump-supporting co-worker touted that individuals are 3D printing medical supplies as if these incidences are a replacement for government support. This is how it shouldn’t be done.